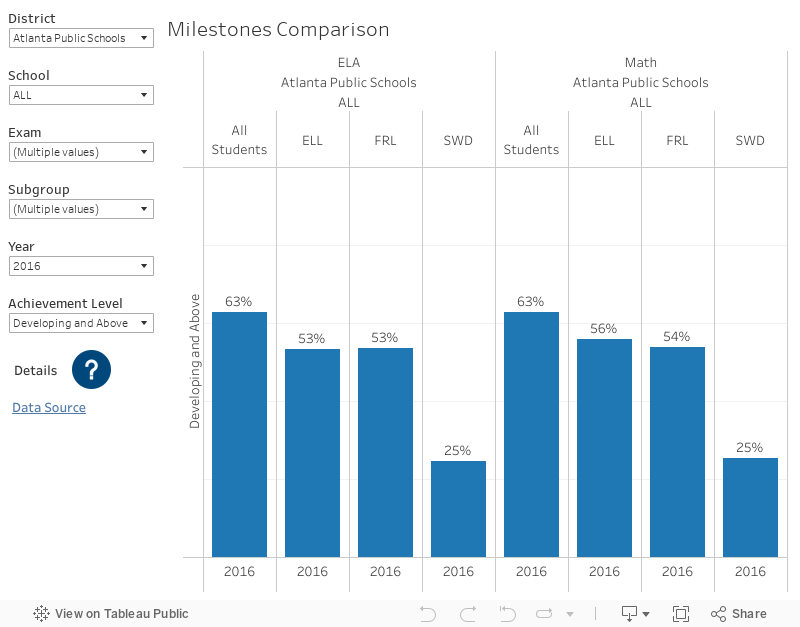
"Developing" refers to the Milestones category that indicates partial proficiency. Mouse over the details icon to see other definitions, such as "ELL". Data for this visual comes from public files provided by the Governor's Office of Student Achievement1.
The acronym, "FRL" is "Free or Reduced Lunch", which allows us to see how low-income students perform. At APS schools that use the community eligibility provision (CEP) all students are marked as FRL in Milestones reporting regardless of actual status. FRL subgroup results are not displayed for these schools.
These graphs can be used to show striking differences. For example, see the gaps in proficiency rates by race below.

Information about income gaps in the city provide helpful context for this graph. The image below, from The Upshot, shows the relationship between socioeconomic status and student achievement by school district and race. Atlanta Public Schools has one of the largest family income gaps by race in the entire country.

Regardless of the root causes, the visual representation of the gap demonstrates the need for improvement. To learn about specific strategies at APS, read about our School Turnaround Strategy.
Let us know on Twitter if you use these visuals to learn something new about your school or district.
1. GOSA Milestones data files include results from summer retests. If a student did better on the summer retest, that score is included in the average. GADOE Milestones data files do not include summer retest results, so achievement levels in the GOSA file are sometimes slightly higher. For most schools the difference is 0-1 percentage points. GOSA files were used because the GADOE files do not break out subgroup scores.