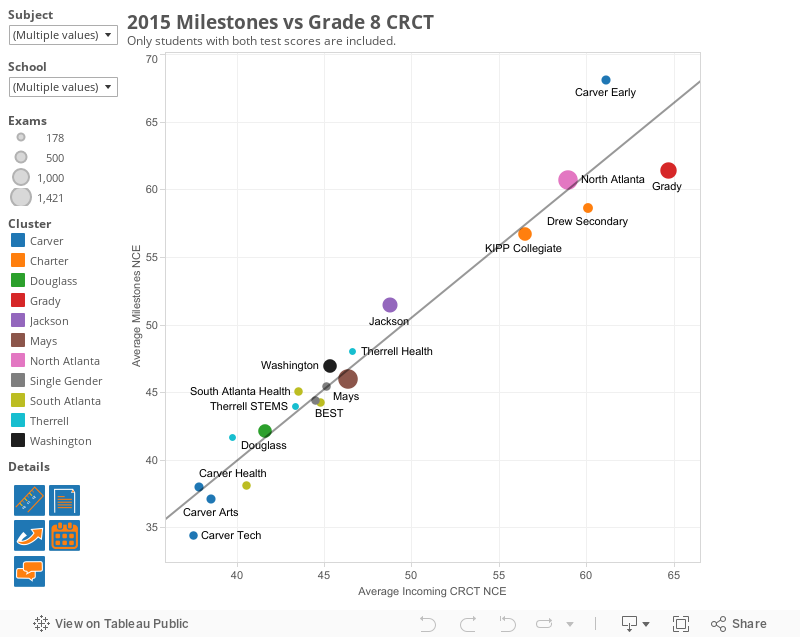
The visual above shows high school performance on the 2015 Milestones and how the same students performed on their 8th grade CRCT. This gives us a picture of how students have grown at their high schools. Data points above the trend line show schools with higher Milestones results than other APS schools with similar students.
This view is a useful measure to think about school productivity. To see Milestones End of Course (EOC) data in terms of achievement levels, see this post. Both data views are helpful for understanding school performance, setting goals, and developing strategies for improvement.
There is a very strong relationship between average incoming 8th grade scores and current test scores- prior test scores explain 94% of the variance in current test scores at the school level. This result is similar to the amount of school test score variance explained by poverty for elementary and middle schools. That post also gives useful context for the high school visual. Although the graph is a useful measure of productivity, it is not comprehensive: "A school that is below the trend line this year might move up next year. Progress points on the CCRPI are a nice compliment to this view. And, perhaps most importantly, test scores are only one measure of a school's outcomes. It's also important to consider information like behavior, student engagement, or relationship with the community."
Test scores in this visual are graphed using NCE scores, which are similar to scale scores, but better for averaging across subjects because they have a uniform mean and standard deviation. This visual also provides criterion information with hover text; mouse over the graph to see the percentage proficient on the Milestones, and percentage Exceeds on the CRCT.
The use of incoming test scores as a control variable incorporates middle school effectiveness into the results. For example, we know from APS middle school data that KIPP middle schools tend to out-perform other schools with similar poverty rates. Many of these students go on to KIPP Collegiate. It is more challenging to sustain performance levels of students who have attended previous high-growth schools than it is to sustain performance of students who attended low-growth schools. Education research shows that interventions often have a fade-out in years following the intervention of 1/2 to 3/4 of the original positive effects. In this case, an effective middle school is the intervention, and the high school must also be above average to prevent fade-out.
Other useful information on APS EOC Milestones results can be found on the superintendent's blog, and in this visual that shows each school's state percentile rank by exam.