The switch from CRCT to Georgia Milestones will benefit Georgia education in several ways. The more rigorous achievement levels will better inform schools and parents of their students' readiness for college and career, and the open-response questions will increase emphasis on writing instruction and critical thinking.
In addition to increased rigor and open response questions, the 2015 Georgia Milestones results include national percentile scores. These scores are reported for each student as a supplement to the achievement and scale scores, calculated using a subset of 20 nationally-normed TerraNova items for each exam. This is a common psychometric method for creating a national percentile, but can yield odd results due to the number of questions and curriculum alignment. For example, the graph below shows the relationship between student's eighth grade science scale score and their national percentile.
Scale Score vs. National Percentile, 2015 APS Eighth Grade Science Milestones

Although students who have a high scale score tend to also receive a high national percentile, the graph shows substantial variation. Students who scored at the high end of Beginner (~470) received a national percentile of anywhere from 1 to 94.
This variation is likely because only a subset of questions are nationally-normed. Although this method of calculating national percentiles is common, we recalculated national percentiles with a method that preserves students' scale score rank order. To do this, we used NAEP results to compare Georgia test score distributions to the national distribution, and then used that information, in conjunction with state means and standard deviations on the Milestones exam, to convert each scale score directly to a national z-score. We then used a cumulative normal distribution to convert from national z-score to national percentile.
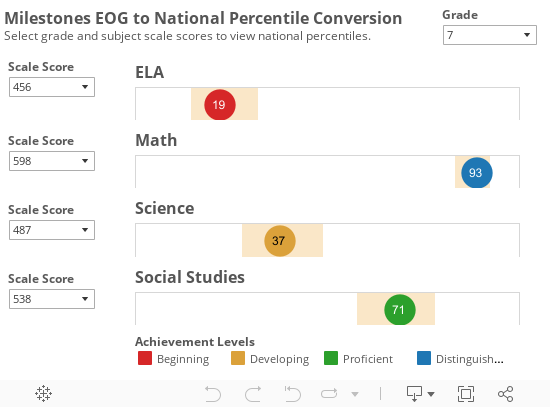
We put the results in the visualization below. Select a grade and enter a student's Milestones score for each subject to see their national percentile. The visual also shows a confidence interval, based on both the Milestones scale score uncertainty, and the uncertainty in the relationship between Georgia's mean and the national mean. For example, the default view shows that a seventh grade student with an ELA scale score of 456 has an estimated national percentile of 19. The upper bound of the estimate is 30, and the lower bound is 11.
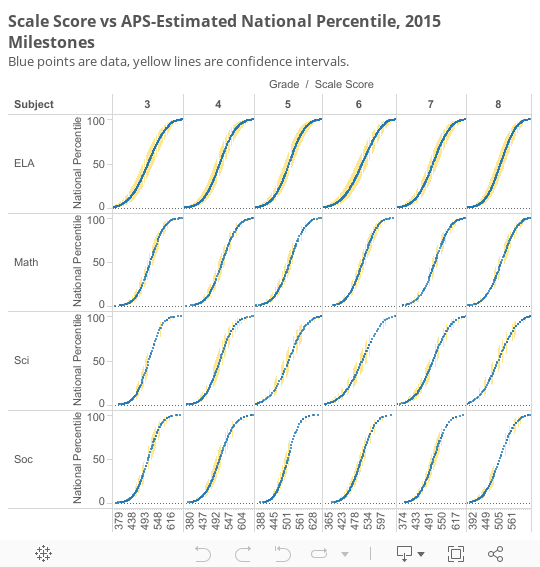
These percentiles were based on 2015 data, but should be mostly unchanged for 2016 results. As a final comparison, the graph below shows the relationship between scale score and the APS-estimated national percentile for each grade and subject. Notice that each scale score has only one estimated national percentile instead of a large range.
Let us know on twitter what you think, or if you'd like more details on the conversion formula. See the superintendent's blog for more information on Milestones performance in Atlanta Public Schools, or see previous posts on this blog.
In addition to increased rigor and open response questions, the 2015 Georgia Milestones results include national percentile scores. These scores are reported for each student as a supplement to the achievement and scale scores, calculated using a subset of 20 nationally-normed TerraNova items for each exam. This is a common psychometric method for creating a national percentile, but can yield odd results due to the number of questions and curriculum alignment. For example, the graph below shows the relationship between student's eighth grade science scale score and their national percentile.
Scale Score vs. National Percentile, 2015 APS Eighth Grade Science Milestones
Although students who have a high scale score tend to also receive a high national percentile, the graph shows substantial variation. Students who scored at the high end of Beginner (~470) received a national percentile of anywhere from 1 to 94.
This variation is likely because only a subset of questions are nationally-normed. Although this method of calculating national percentiles is common, we recalculated national percentiles with a method that preserves students' scale score rank order. To do this, we used NAEP results to compare Georgia test score distributions to the national distribution, and then used that information, in conjunction with state means and standard deviations on the Milestones exam, to convert each scale score directly to a national z-score. We then used a cumulative normal distribution to convert from national z-score to national percentile.
We put the results in the visualization below. Select a grade and enter a student's Milestones score for each subject to see their national percentile. The visual also shows a confidence interval, based on both the Milestones scale score uncertainty, and the uncertainty in the relationship between Georgia's mean and the national mean. For example, the default view shows that a seventh grade student with an ELA scale score of 456 has an estimated national percentile of 19. The upper bound of the estimate is 30, and the lower bound is 11.
These percentiles were based on 2015 data, but should be mostly unchanged for 2016 results. As a final comparison, the graph below shows the relationship between scale score and the APS-estimated national percentile for each grade and subject. Notice that each scale score has only one estimated national percentile instead of a large range.
Let us know on twitter what you think, or if you'd like more details on the conversion formula. See the superintendent's blog for more information on Milestones performance in Atlanta Public Schools, or see previous posts on this blog.