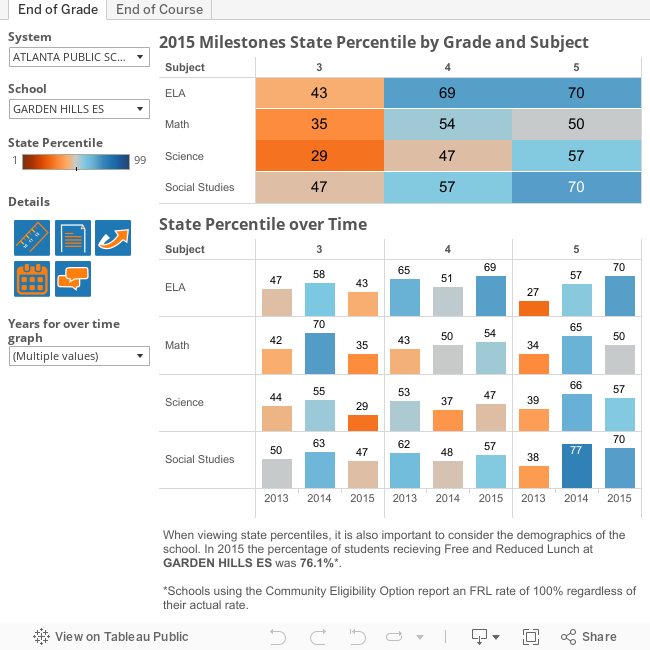
The visual above shows scale score percentiles on Georgia end of grade exams. The percentiles show a school's relative position among all Georgia schools. For example, a percentile of 45 indicates a school's average scale score is higher than 45% of schools in Georgia.
The top part shows a heat map of performance by grade and subject, while the second part brings in additional years of data to show performance over time. 2015 data is from the Georgia Milestones, while previous years are from the CRCT. Using state percentile allows comparison across exams because although the exam changed, the comparison group does not- the comparison group is all other schools in the state in both cases. Click on the End of Course tab to see similar data for high schools.
Scale score is used instead of proficiency rates to calculate state percentiles because scale scores are a continuous measure that capture all levels of achievement, while a proficiency rate is a binary measure for an individual student.
The filters in the top right allow the user to choose any public elementary or middle school in the state. This view shows that the default school, Garden Hills of Atlanta Public Schools, had higher performance relative to the state in grades 4 and 5 than in grade 3. Free lunch percentage is also reported at the bottom of the visual to provide additional context. Garden Hills has a high percentage of free and reduced lunch eligible students- 76.1%. (They also have a high English Language Learner percentage.) Schools with high free lunch percentages tend to have lower test scores. In this context, the grades and subjects where Garden Hills has a state percentile over 50 are quite high performing. A forthcoming post will explore the relationship between poverty and test scores in more detail. (Use the email subscription box on the right to be notified of this post, or follow us on Twitter.)
This view is helpful in conjunction with our view of achievement levels. The percentile view facilitates within school comparison across years, grades, and subjects by using state percentile as a single, consistent indicator. This makes it easier to identify areas of strength and areas for improvement. Meanwhile, the achievement levels view, by emphasizing achievement bands, helps us focus on our goals of preparing every student for college and a career.
For more information on the performance of APS students on Georgia Milestones, please see the superintendent's blog post on the topic.